Why couldn't Ricardo stick with the spreadsheet?
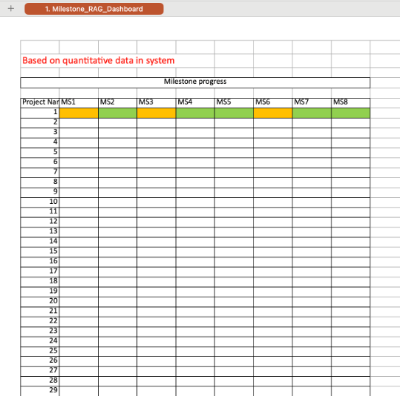
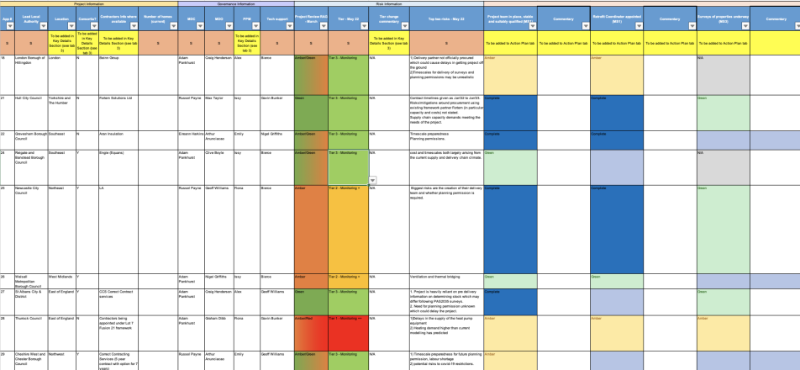
During the trial Ricardo Project managers created a spreadsheet to keep everyone up to date with project progress. This had already been unwieldy, unmanageable and very slow to maintain. We set out to make it easy to update and scan for key information.
Originally thinking that a simple table on a spreadsheet would be enough, they quickly added more cells and filters. Monthly they'd need to export content to report to other stakeholders - taking several hours at a time. Sharing the document on the team drive meant it was easily duplicated and new versions created making data management difficult.
This was used for 15 Local Authorities and a sample of projects per LA, if the SHDF project were to rollout nationwide (which it was likely to do) then this would very quickly become unusable.
What we did
After having a chat with Eireann and her team to understand the project and a run through of the spreadsheet, how often it's updated, what her team's priorities are, the pain points they currently have and how they'd love the tool to be. I set about organising the information into a data structure that made sense. Typically I'd do this with the team making the tool but they hadn't been assigned at this point.
Eireann told me that most people using the tool would be desktop users, which made the job much easier, but a lot of Local Authorities had old laptops with small screens which they might use without an external monitor or plugged into a projector.
The problem was to fit all of the content nicely onto a screen, with minimal scrolling (vertically and horizontally). We needed to break the content down into manageable chunks and figure out what was the most important part of each chunk and what was secondary information that didn't need to be presented so could be shown after a click.
Then we had to figure out what bits really needed filters, currently everything was filterable. What bits need to be read only and what could be updated by anyone.
Because the project was a trial there wasn't much user research to go on, so we had to keep asking ourselves "What is the user looking for when they go to this screen?"
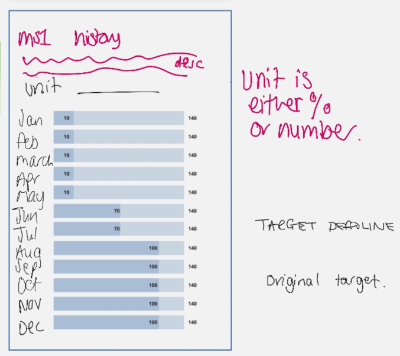
I used miro to quickly draw some wireframes of important screens and sections, checking them with the team as I went. Some components needed to be reworked several times, a table with number values wasn't enough in some areas, it needed to be easier to scan
The results
I polished up the wireframe in miro because essentially this was just text in boxes, miro does that well and fast, I didn't need to break out Figma or make a HTML prototype for this. The development team said they had a bunch of pattern libraries they said they'd use to build the project, so my key concern was layout and accessibility. Ensuring RAG statuses were more than just colours and tables had labels.
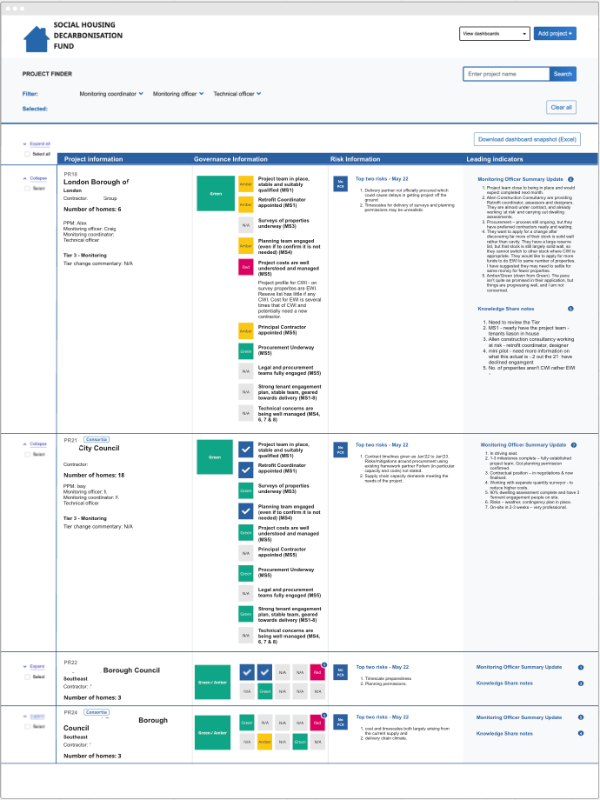
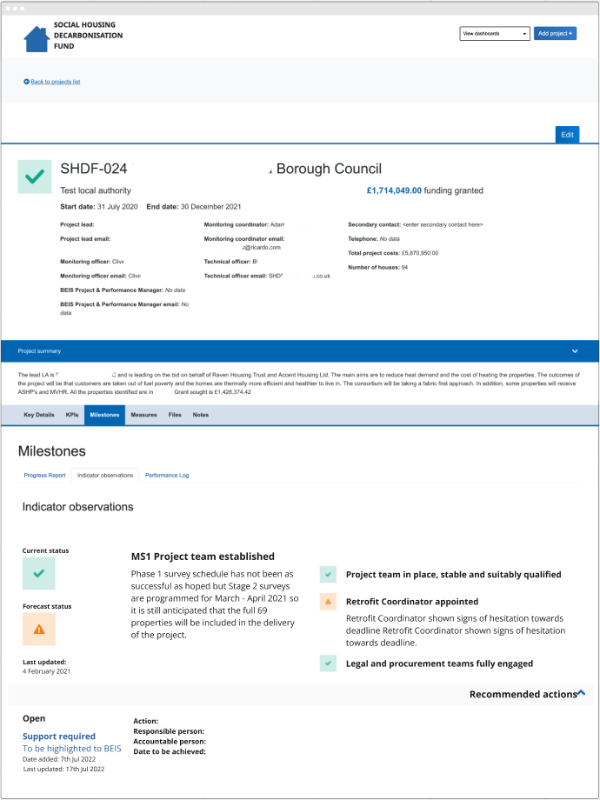
The resulting design was a lot of tabs, expanding areas and the wireframe became the final design, which I always enjoy as keeping things simple is one of our values.
The project list page showed statuses of all 8 of the project's milestones, the overall project score, key information for people to find who to contact and notes on risk management and leading indicators for other project managers to take key insights from, all filterable by the different people in a project.
Several projects could be selected at once to be downloaded into an excel spreadsheet for reporting purposes and by having an application instead of a spreadsheet to track all of this, the team, housing groups, and Local Authorities could all have access to their own sections and an area to share key results so that project managers could learn from previous projects and make better decisions.
"Just did a bit of a review with the SHDF team - you are basically the star of the show. This is going to be a game changer! thank you!"
We free'd up hours of administration time, made it much easier for the team to work together and provided a secure way to hold and manage all of this vital information.
Not bad for a proof of concept, huh.

